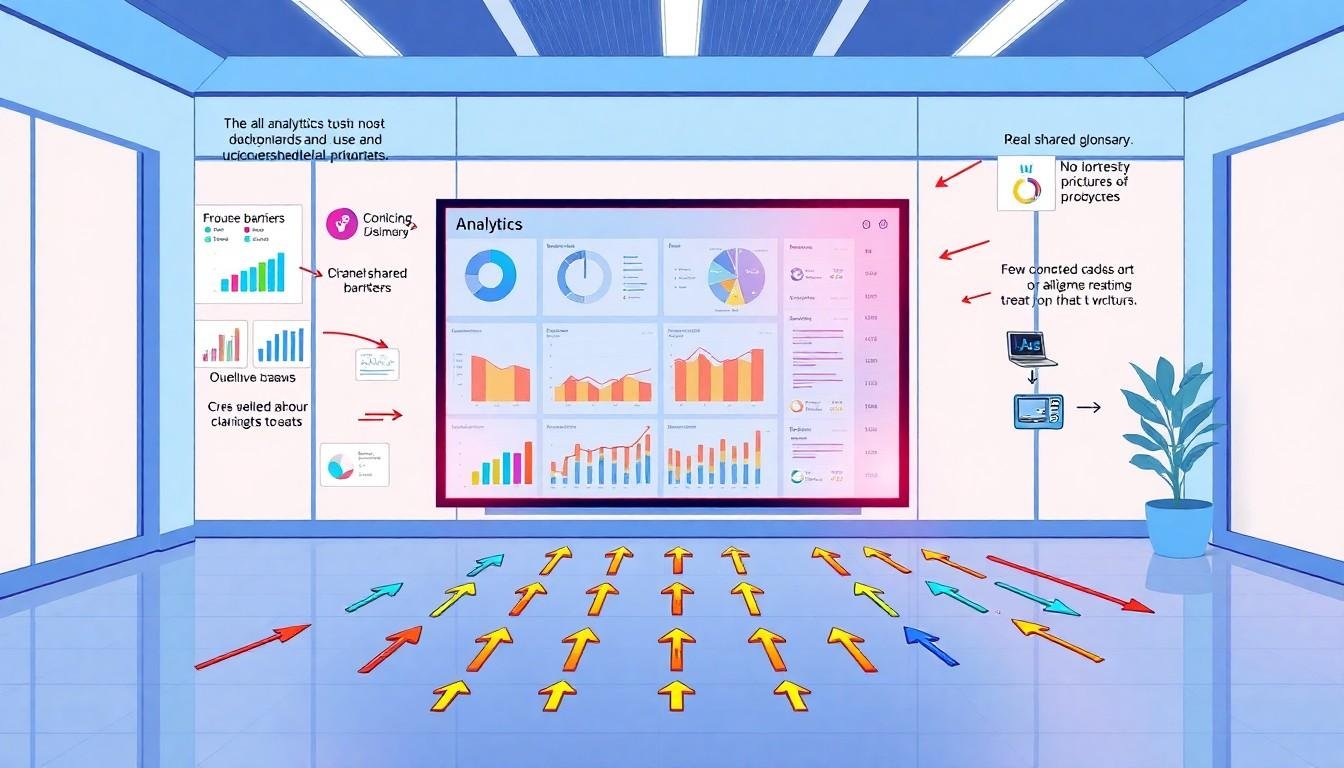
A dashboard can be elegantly designed and still be ignored. The reason, argues the Nightingale article’s author, is often not a flaw in its charts but a failure to resolve the organisational questions around them: what the numbers mean, whether people trust them and who decides what belongs on the screen.
The author describes three recurring problems. First, colleagues may use the same metric to mean different things. A finance team’s understanding of revenue, for instance,...
Continue Reading This Article
Enjoy this article as well as all of our content, including reports, news, tips and more.
By registering or signing into your SRM Today account, you agree to SRM Today's Terms of Use and consent to the processing of your personal information as described in our Privacy Policy.
may differ from sales’ or leadership’s. Presenting one figure without settling those definitions can make a dashboard appear wrong to everyone who expected a different calculation.
The author says a real-estate analytics project addressed this by creating a governed semantic layer: a central set of definitions and calculations intended to ensure that reports draw on the same meaning for each metric. IBM describes semantic layers in similar terms, as a business-facing way to organise definitions, calculations and key performance indicators across reports. The author reports that adoption of analytics rose by 55 per cent and reliance on analysts for basic answers fell by about 25 per cent in that project. Those figures are based on the author’s account and are not independently verified by IBM’s explanatory material.
The second obstacle is trust. Employees may stick with a familiar spreadsheet, even when a dashboard is faster and more reliable, because they can see how the spreadsheet produces its results. A new tool can seem opaque by comparison. The author’s proposed remedy is to involve intended users early, using preliminary sketches they can question and shape before development is complete.
Research offers support for the broader point, while also showing that adoption depends on circumstances. A qualitative study of two quality dashboards in a Dutch hospital found that team climate, trust and leadership influenced whether staff used the tools. In settings where people could discuss troubling results without fear of blame, dashboards were more likely to inform learning and improvement. A separate evaluation of QualDash, introduced across eight clinical services in five healthcare organisations in England, found that use varied between settings. Local resources, established reporting routines, staff interactions and whether the measures matched users’ expectations all mattered. The findings do not establish that co-design will work in every organisation, but they underline how strongly a dashboard’s usefulness can depend on the workplace around it.
The third problem is the gradual accumulation of requests. A dashboard may begin with a clear purpose, then acquire extra measures, comparisons and regional breakdowns as different stakeholders ask for additions. Each request may be reasonable; together, they can obscure the original question.
The author recounts an analytics project for a market-research firm in which reporting had expanded to 66 dashboards and about 49,200 calculated fields. After reorganising the data and consolidating the reports, the author says the dashboard count fell by 96.97 per cent, calculated fields by 99.85 per cent, and performance improved by about 95 per cent. These are the author’s reported project results, not figures corroborated by the other sources.
The risks of unchecked expansion are also described by TechTarget, which reports that self-service analytics can allow duplicate dashboards and inconsistent calculations to proliferate faster than governance can keep up. The result may be confusion over which figures are correct, wasted resources and reduced confidence in analytics. But reducing the number of dashboards is not, by itself, a measure of success: useful reporting must be retained, with clear ownership and consistent definitions.
Adoption figures point to a persistent gap between access and everyday use. IBM, citing Gartner, says analytics and business intelligence tools are used by an average of 29 per cent of employees. That estimate is lower than the roughly one-third figure cited in the Nightingale article, reflecting a different stated measure or reporting context; neither should be treated as a universal rate. IBM also notes that complicated interfaces and summaries that do not help users decide what to do can limit uptake.
A 2025 scoping review of 89 public-health dashboard case studies in the United States adds a further caution. Only 23 cases described co-design, while 39 reported little or no input from intended users. The review found that usability and use were more commonly assessed than usefulness or impact. Its findings relate to public-health dashboards rather than corporate analytics, but they reinforce the need to evaluate whether a tool supports real decisions, not simply whether it has been built or accessed.
Taken together, the evidence suggests that visual quality is only one part of dashboard design. Shared definitions, transparent calculations, fit with existing work and a supportive environment can all affect whether people act on what they see. For designers and analytics teams, the work may begin before the first chart is drawn: agreeing what a measure means, asking users what they need and deciding which requests genuinely serve the dashboard’s purpose.
Source: Noah Wire Services