Sievo’s food and beverage procurement benchmarks offer a snapshot of purchasing performance across a large enterprise cohort, but they are historical comparisons, not predictions for 2027. The report analyses $128.1 billion in procurement spend, with KPI observations running from July 2025 to June 2026.
Across the cohort, the median share of spend handled through formal purchase orders was 73.6%. Contractual payment terms averaged 56.2 days, while companies paid 2.2 days afte...
Continue Reading This Article
Enjoy this article as well as all of our content, including reports, news, tips and more.
By registering or signing into your SRM Today account, you agree to SRM Today's Terms of Use and consent to the processing of your personal information as described in our Privacy Policy.
r the due date on average. Procurement spend represented 68.4% of revenue; median spend was $9,500 per invoice and $277,000 per active supplier.
Sievo says the figures are based on customer purchase orders, invoices and supplier transactions contributed voluntarily to its Community Data service. The data is anonymised, cleansed and aggregated. The company describes the benchmarks as peer comparisons rather than universal targets, and says quartiles are calculated separately for each metric.
The overall medians conceal substantial differences between purchasing categories. Purchase-order coverage reached 94.4% for direct spend excluding packaging and 96.2% for packaging, but stood at 61.8% for indirect procurement. The 75th-percentile figures were 99.5% for both direct spend and packaging, and 83.9% for indirect spend.
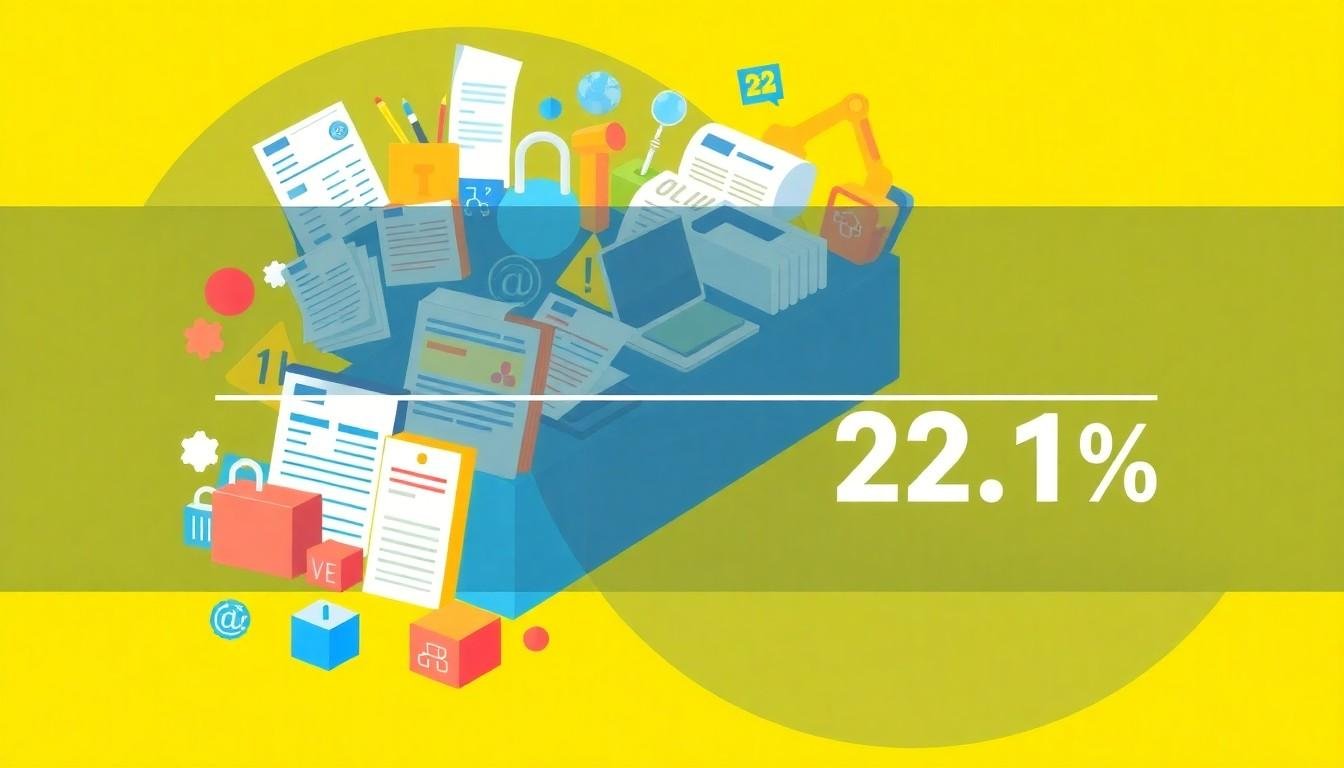
That makes indirect procurement the clearest area for closer examination: its gap between the median and 75th percentile was 22.1 percentage points, compared with 5.1 points for direct spend excluding packaging and 3.3 points for packaging. The figures do not explain why the gap exists, but they point to questions companies can investigate, including which categories generate non-PO purchases, whether ordering practices vary by site, and whether orders are sometimes raised only after invoices arrive.
Payment terms also differ by category. Median contractual terms were 53.5 days for direct spend excluding packaging, 70.5 days for packaging and 51.8 days for indirect spend. Sievo’s report models the working-capital effect of the gap between stronger- and weaker-performing companies, estimating opportunities of $5.1 billion across selected direct categories, $2 billion across selected packaging categories and $5.1 billion across indirect categories.
Those figures are scenarios across the analysed dataset, not cash already released or savings guaranteed to an individual business. Sievo’s wider announcement puts the theoretical opportunity across all ten industries in its series at $27.9 billion. It says the estimates apply differences in payment terms between top- and bottom-quartile companies to category spend. As an illustration, the announcement reports that top-quartile food and beverage companies pay cocoa and industrial chocolate suppliers after 85 days, compared with 42 days for bottom-quartile companies.
Longer terms may support working capital, but they are not automatically beneficial. Supplier capacity, criticality, available alternatives, production schedules and the effect on prices all matter. A target derived from a peer percentile should therefore prompt analysis, not dictate a change in commercial terms.
Procurement performance also extends beyond spend controls and payment timing. Sievo recommends tracking measures such as realised savings, supplier concentration, on-time-in-full delivery, rejected lots, remaining shelf life and temperature compliance. The US Food and Drug Administration’s sanitary transportation guidance underscores why handling indicators matter: food safety during transport can depend on suitable vehicles, operating practices, training and temperature controls where required.
This broader approach is consistent with guidance from APQC, which advises organisations to define metric formulas and scope before making comparisons and to assess procurement through a balanced set of measures. Its examples include purchase-order processing, supplier delivery, invoice payment, process efficiency and buying outside established procedures. APQC also cautions that supplier concentration needs context: reliance on a small number of suppliers may strengthen buying leverage, but can also increase dependency risk.
For companies using Sievo’s figures, the practical task is to compare like with like. Direct materials, packaging and indirect purchasing should be assessed separately, with consistent definitions and observation periods. Differences in business model, supplier relationships and operating requirements can all affect what constitutes a reasonable target. The benchmarks can help identify where to investigate, but a company’s own operational and commercial circumstances determine what action makes sense.
Source: Noah Wire Services